Recently, the Brand Wings through-channel marketing automation platform deprecated its predefined dashboard charts in favor of a fully customizable Analytics module. This is the second of three blog articles explaining how to get the most out of Analytics. Click here to read the first article.
Charts and graphs on a dashboard are interesting and often helpful. But all too often, they simply don't provide adequate insight to drive improvements to the business. Consider the chart below, which indicates the number of marketing activities performed by one of our channel partners each day over the last 14 days:
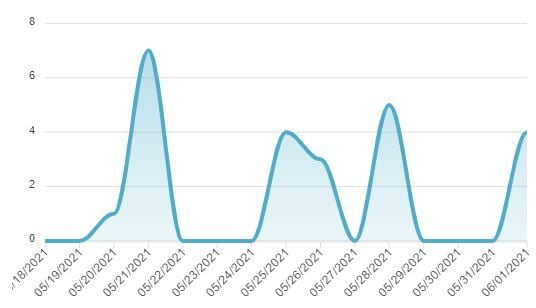
The good news is that we can quickly and visually gain an understanding of this channel partners activities on a daily basis. But it also evokes new questions, such as:
- Is my partner performing more or less activities as this time period progresses? Ideally we want partners to perform at the same level or increase activities.
- Is this an appropriate amount of activities for this channel partner? How do I know if it is?
Clearly this chart needs additional information to be truly meaningful.
The question about whether the partner is performing more or less activities as the time period progresses is easily answerable. A trend line can be added to the chart. In order to draw the trend line, Brand Wings uses a mathematical formula called a linear regression. In essence, the trend line takes into consideration the highs and the lows and gives you a single, easy-to-understand line that summarizes all the data. Here's our chart with the trend line added:
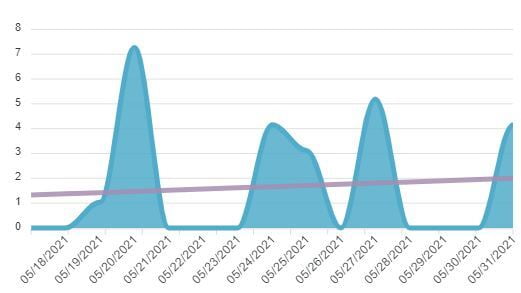
In this case we can see the trend line going slightly up. In our case this is good news... it means that we are getting an increasing amount of activity from this channel partner. This may not have been readily apparent as the peak value is in the beginning of the time period.
The next question about interpreting the results is more difficult. We want to quickly know if this aligns with our expectations. Fortunately Brand Wings has some sophisticated tools for setting targets. By going into the chart options, we can check the "Show Target" option. Next, we can enter in a target. The simplest approach is to enter a number. Here's the chart with a target of 3 set:
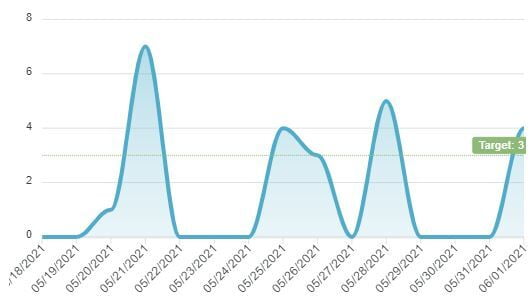
This target line is helpful. We can immediately see the target and therefore which days the channel partner was successful. When combined with the trend line, we get even more quick visual feedback about whether we need to address any potential issues with the channel partner or not.
As we consider the long term, however, using a simple number as the target really isn't satisfactory. If the channel partner adds more sales staff, for example, wouldn't we want to increase our expectations of them? Fortunately there's a way to do this.
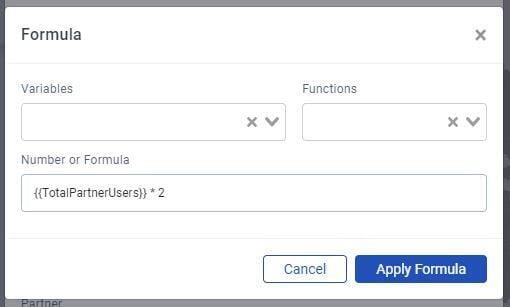
In the chart options, click the formula button next to the target area box. This opens up a formula editor. The goal is to write a formula that Brand Wings can use to dynamically calculate the target. You'll notice two drop down lists:
- Variables are a list of dynamic values for the time period selected in your chart. In our example, we are going to use the variable "TotalPartnerUsers", which is the total number of users for the selected channel partner during the 14 day date range of the chart. Selecting one will insert it into the formula area.
- Functions will look familiar to anyone who uses spreadsheets frequently. You can choose from a few hundred common spreadsheet functions and combine them with Variables as well as numbers you provide.
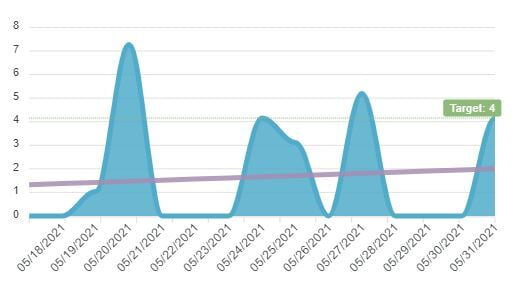
In this example, we are going to use a single variable (TotalPartnerUsers) and multiply it by two. In essence, we are saying that we expect the channel partner to have 2 activities per user per day.
Below is our final result. Since this particular channel partner has two users, the target was automatically calculated to be 4. When combined with the trend line, we can quickly see that this channel partner is not living up to expectations. This tells us to reach out to the partner to better understand what the situation is and work towards a resolution.
In our next article on Analytics, we will learn about creating a KPI program to more effectively manage your sales channel operations.